Interface Overview
When you open a scene in deFlex, you are presented with the main design environment. This page walks through every area of the interface so you know what each part does and how to interact with it.
Layout
The interface is divided into five main regions:
| Region | Position | Purpose |
|---|---|---|
| 3D Viewport | Center | Visual representation of your design domain, preserves, boundary conditions, and solver results |
| Scene Tree | Left panel (floating) | Hierarchical list of all objects in the scene |
| Properties Panel | Right panel (floating) | Settings and parameters for the selected object |
| Primary Bar | Top | Scene name, save status, 2D/3D toggle, undo/redo, settings |
| Secondary Bar | Below primary bar | Creation tools (Design, Input, Output, Boundaries, Analysis, Materials, Run) |
3D Viewport
The viewport is where you see and interact with your design. It renders the geometry, preserves, boundary conditions, gizmos, and solver results in a 3D scene using hardware-accelerated WebGL.
Coordinate system
deFlex uses a Z-up coordinate system, which is the standard convention in mechanical engineering and most CAD tools:
- X — horizontal (left/right)
- Y — horizontal (forward/back)
- Z — vertical (up/down)
A small axis indicator in the corner of the viewport shows the current orientation. The grid lies on the X-Y plane at Z = 0.
Some 3D tools (such as Blender) use Y-up. deFlex explicitly uses Z-up to match engineering convention. If you import geometry from a Y-up tool, you may need to rotate it.
Navigation
You navigate the 3D viewport with your mouse:
| Action | Mouse control |
|---|---|
| Orbit (rotate the view) | Left-click and drag |
| Pan (slide the view) | Right-click and drag, or Shift + left-click and drag |
| Zoom | Scroll wheel |
Orbiting rotates the camera around the center of the scene. Panning shifts the view horizontally and vertically without changing the camera angle. Zooming moves the camera closer to or farther from the focal point.
Click the info icon in the bottom-right corner of the viewport to see a camera controls reference at any time.
Visual elements in the viewport
The viewport displays several categories of visual information:
- Design domain — the outer boundary of the region where the solver can place material. Rendered as a semi-transparent volume or outline.
- Preserves — regions marked as "keep solid." Shown as highlighted overlays on the design domain, typically in a distinct color.
- Boundary conditions — fixed supports and applied forces. Fixed supports appear as hatched or anchored markers. Forces appear as arrows indicating direction and relative magnitude.
- Gizmos — interactive handles for moving, rotating, or resizing objects. When you select a preserve or boundary condition, a gizmo appears for repositioning it.
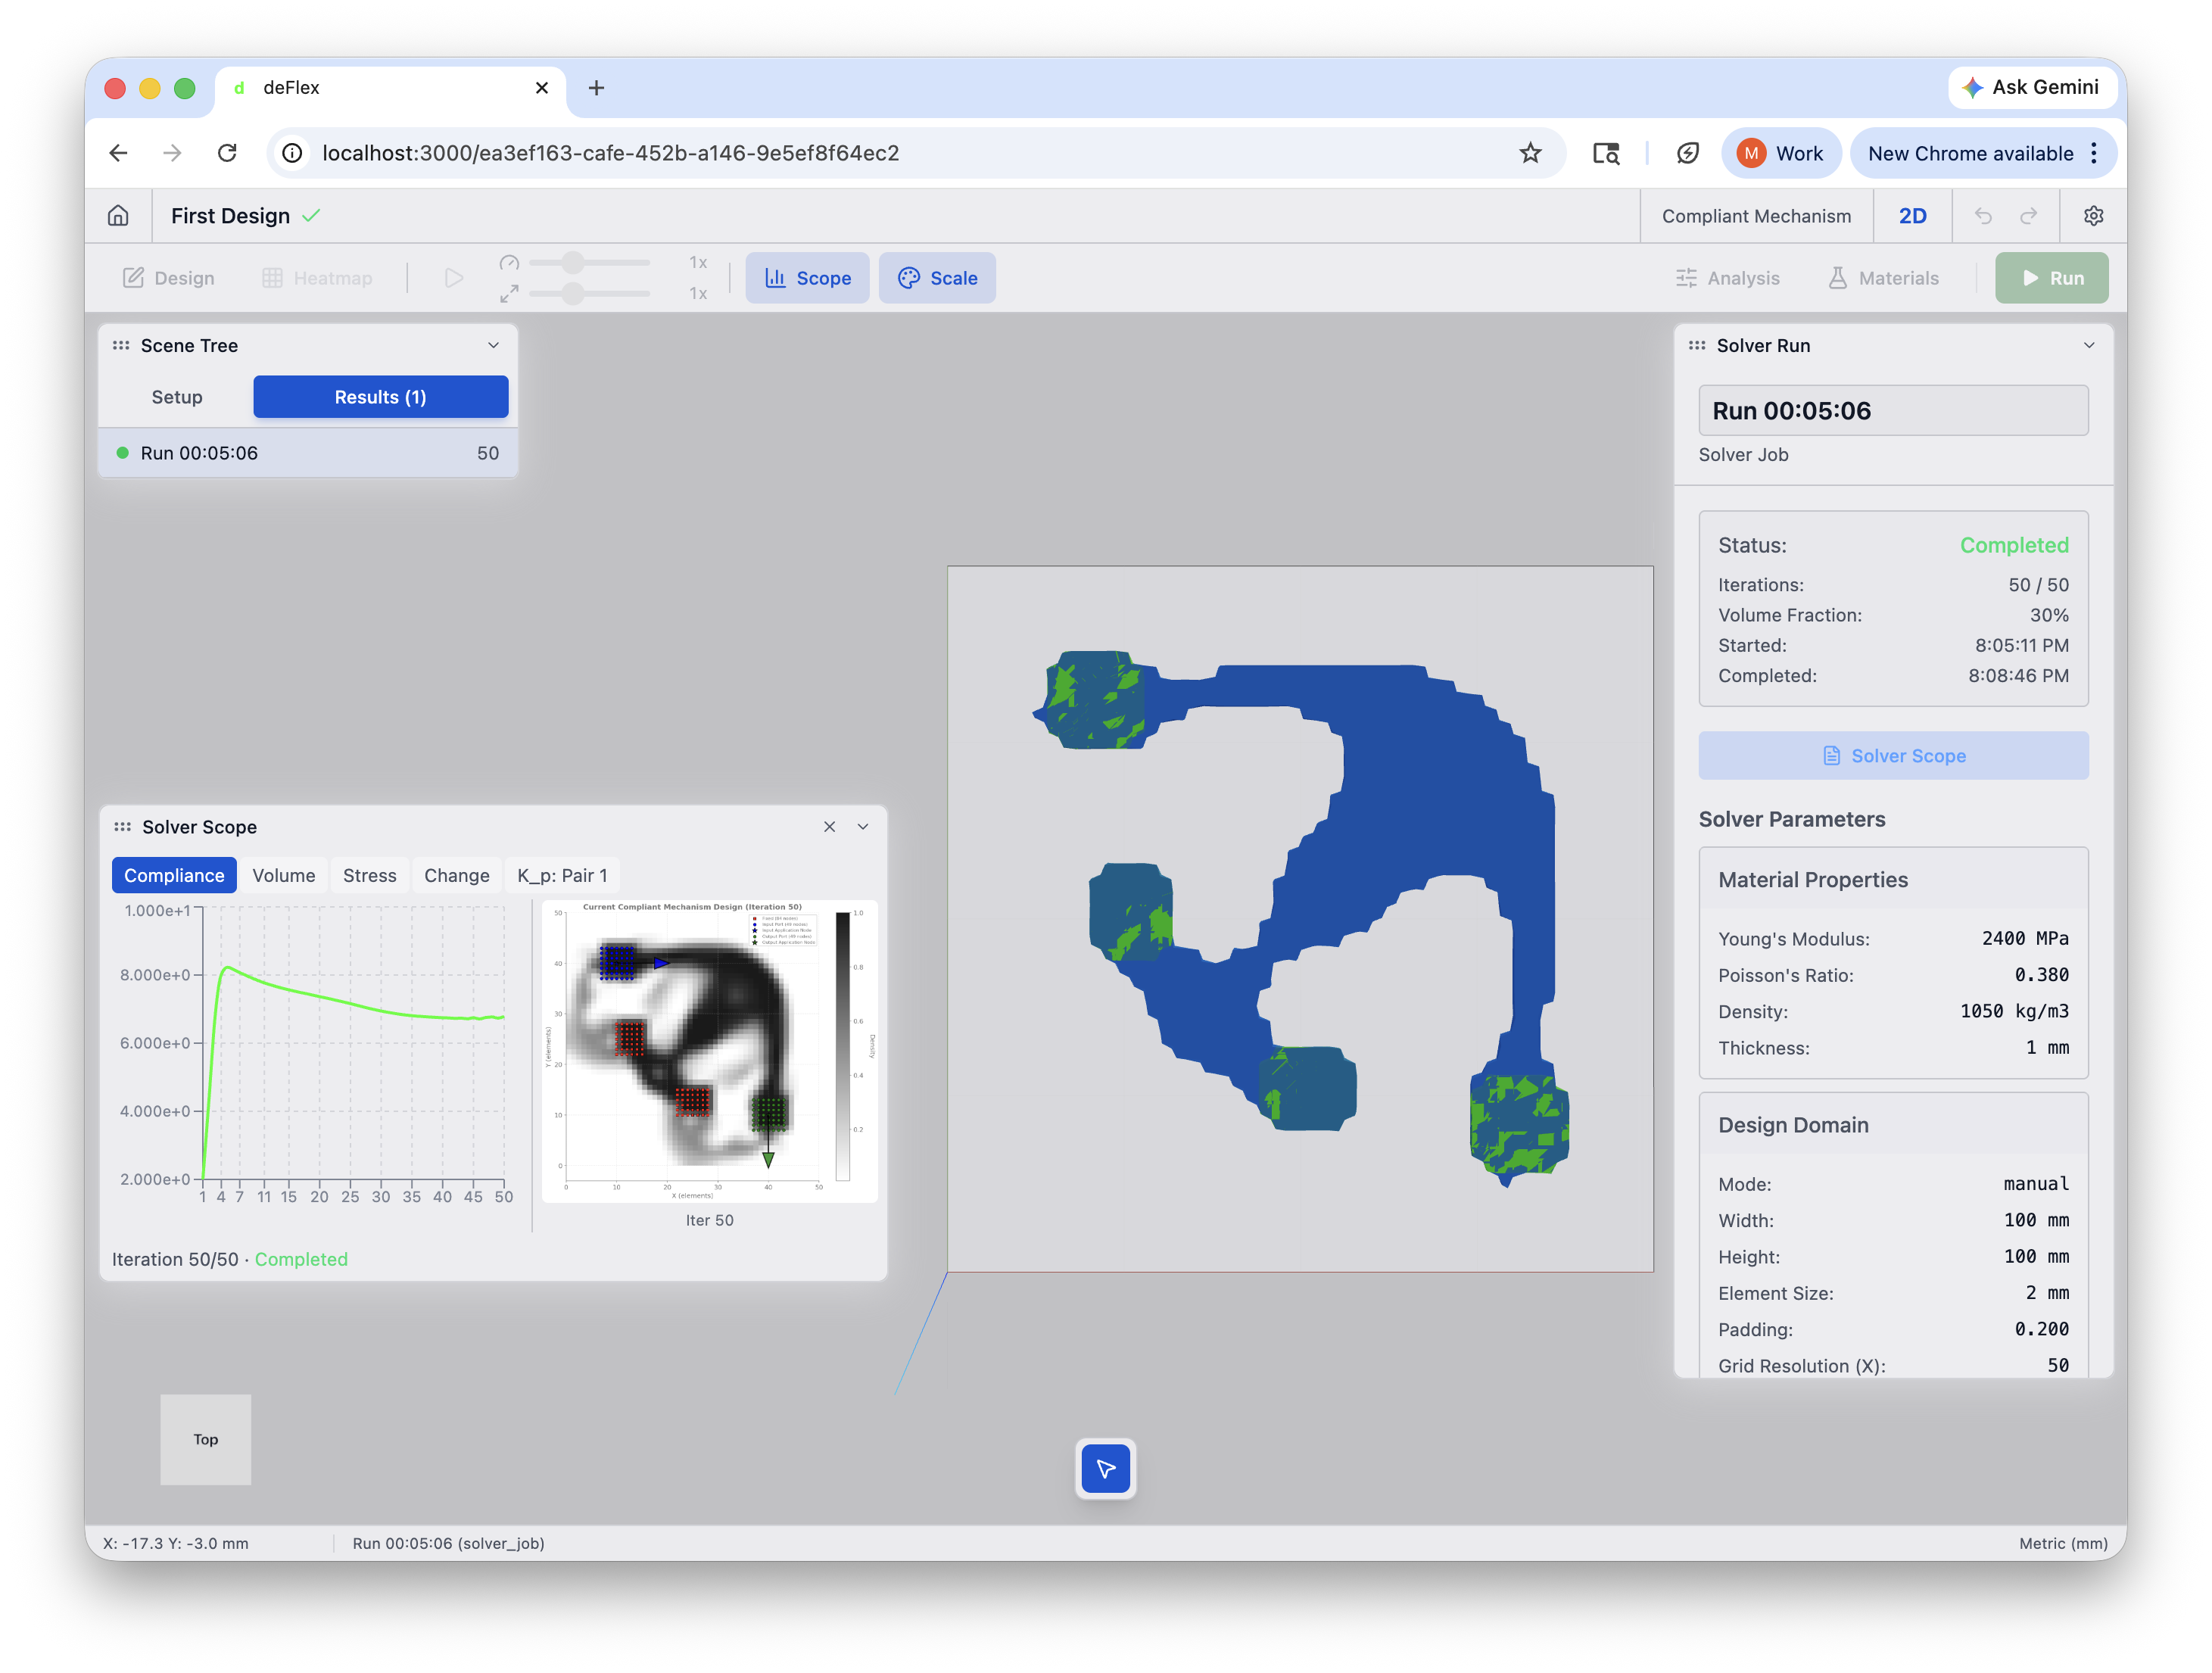
- Solver results — during and after optimization, the material layout is rendered as a color map on the design domain. Solid regions are opaque; void regions are transparent; intermediate densities appear as semi-transparent gradients.
- Grid — a reference grid on the X-Y ground plane. Helps with spatial orientation and approximate sizing.
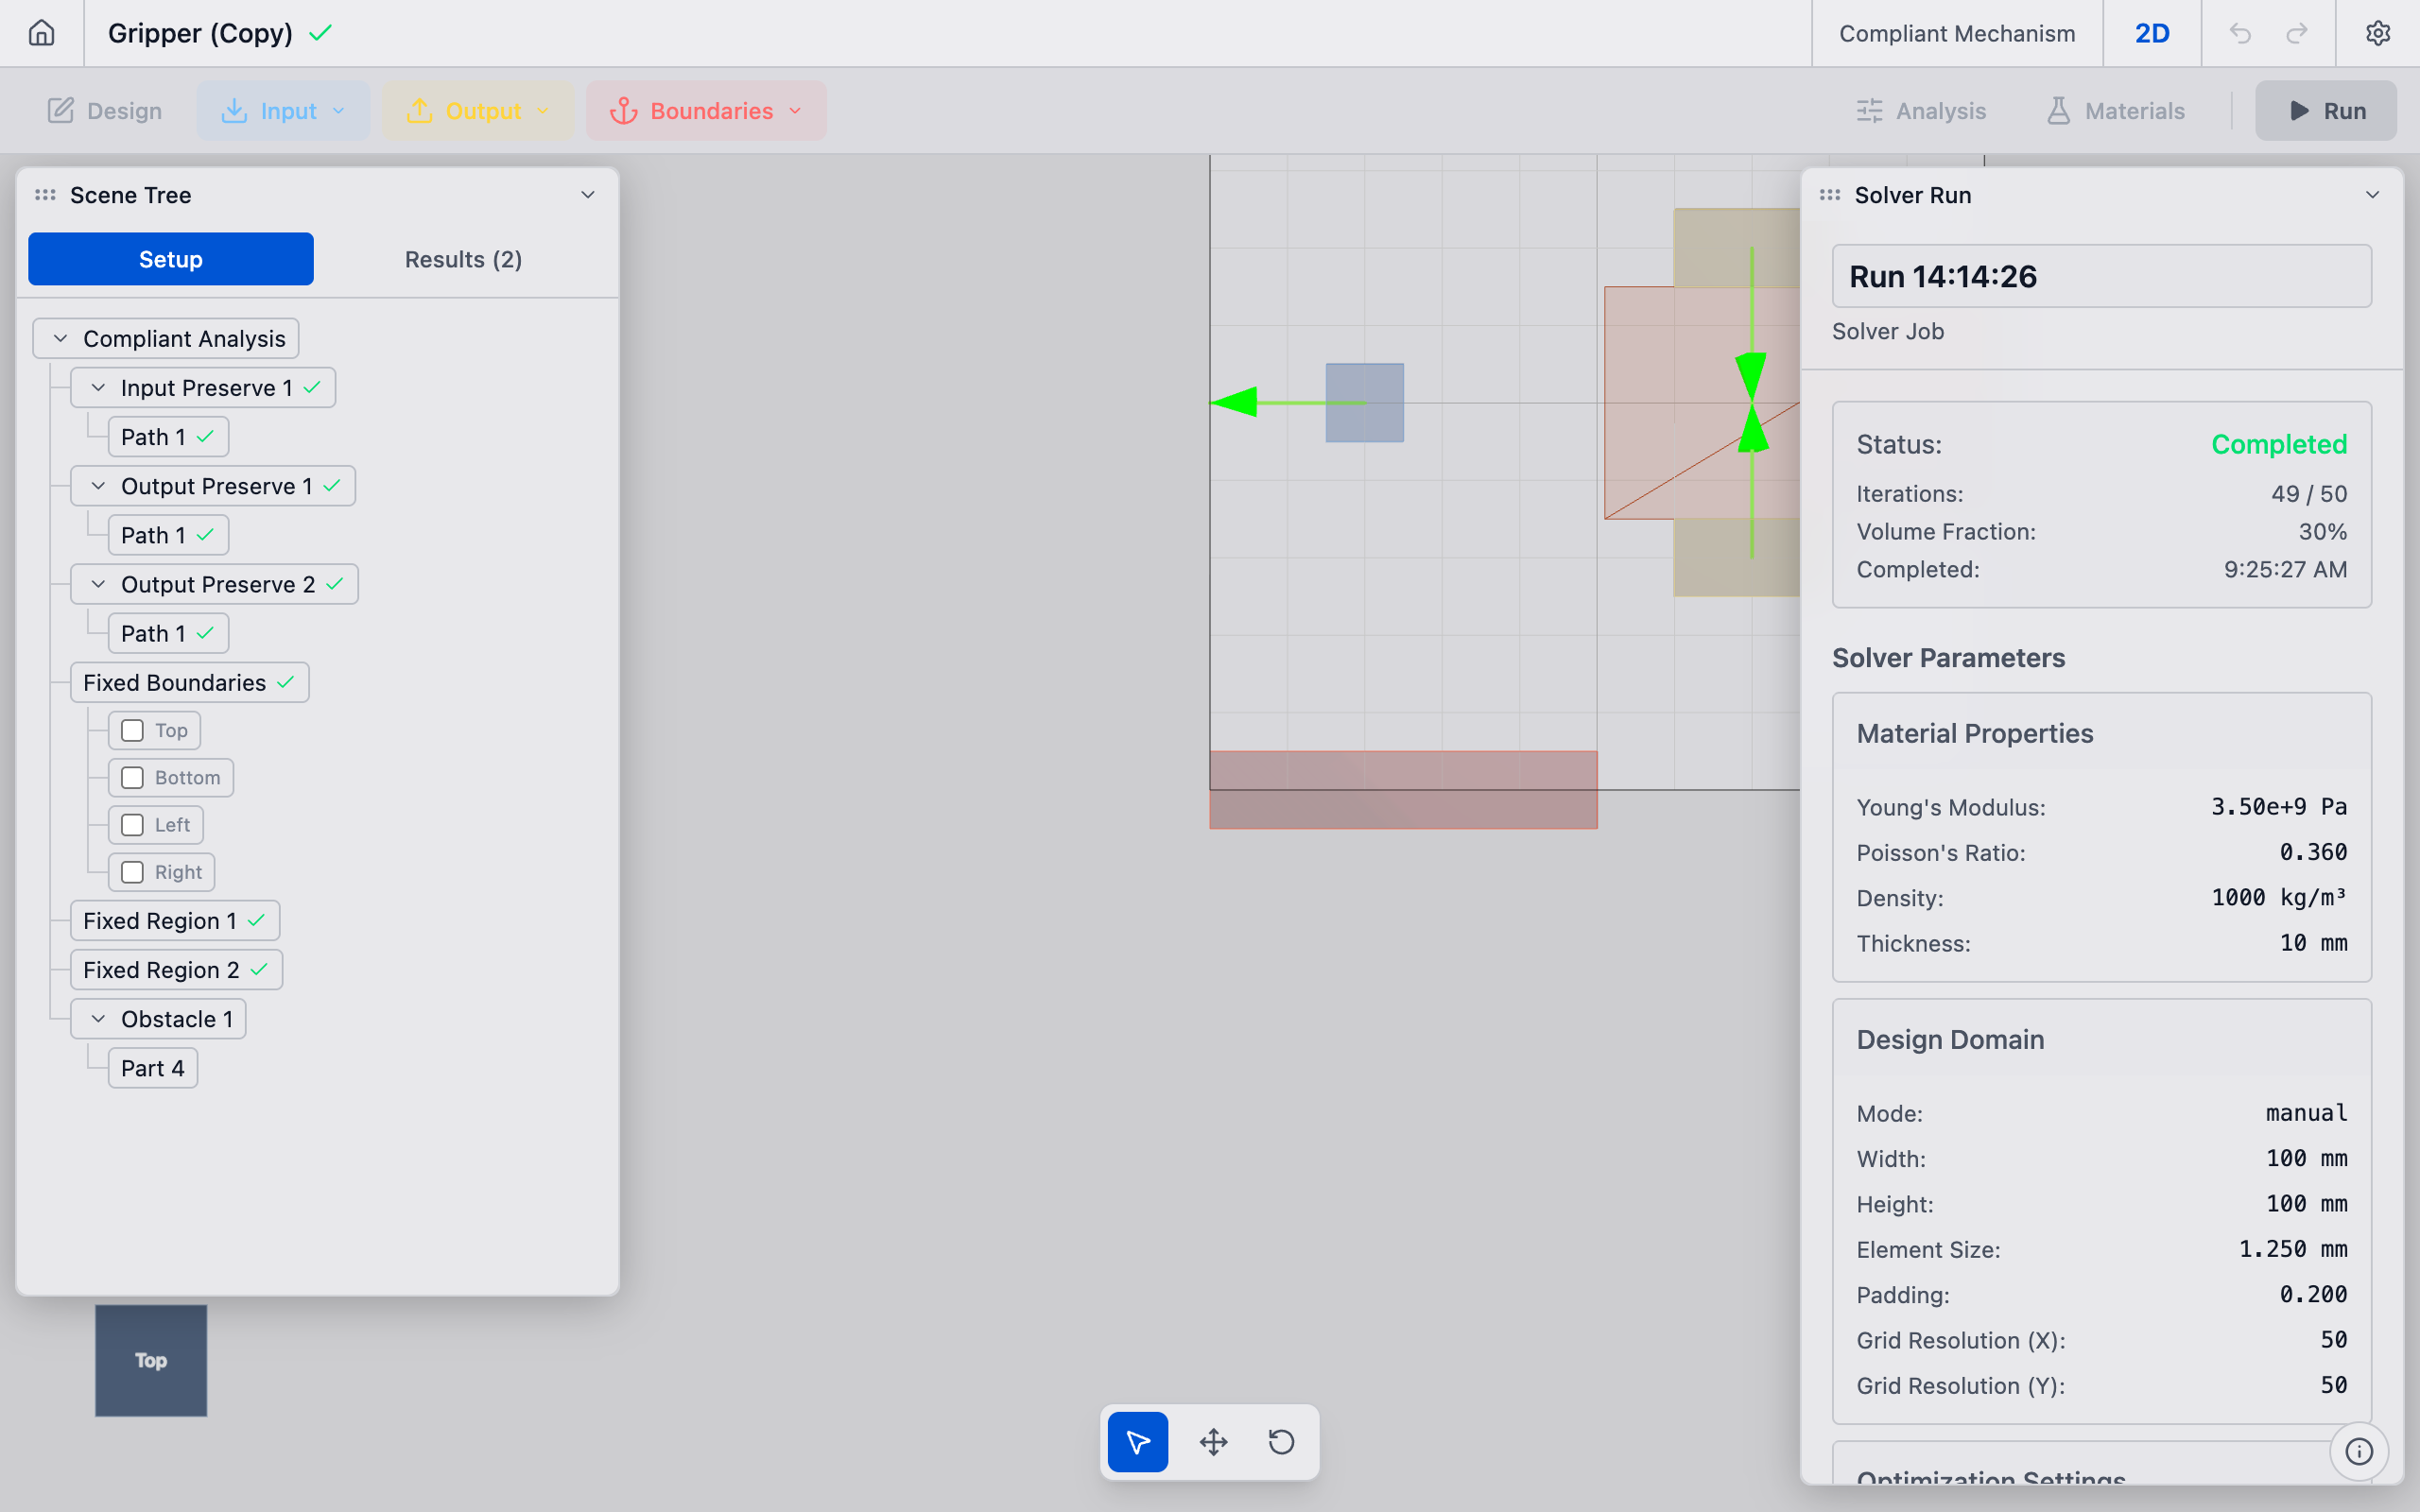
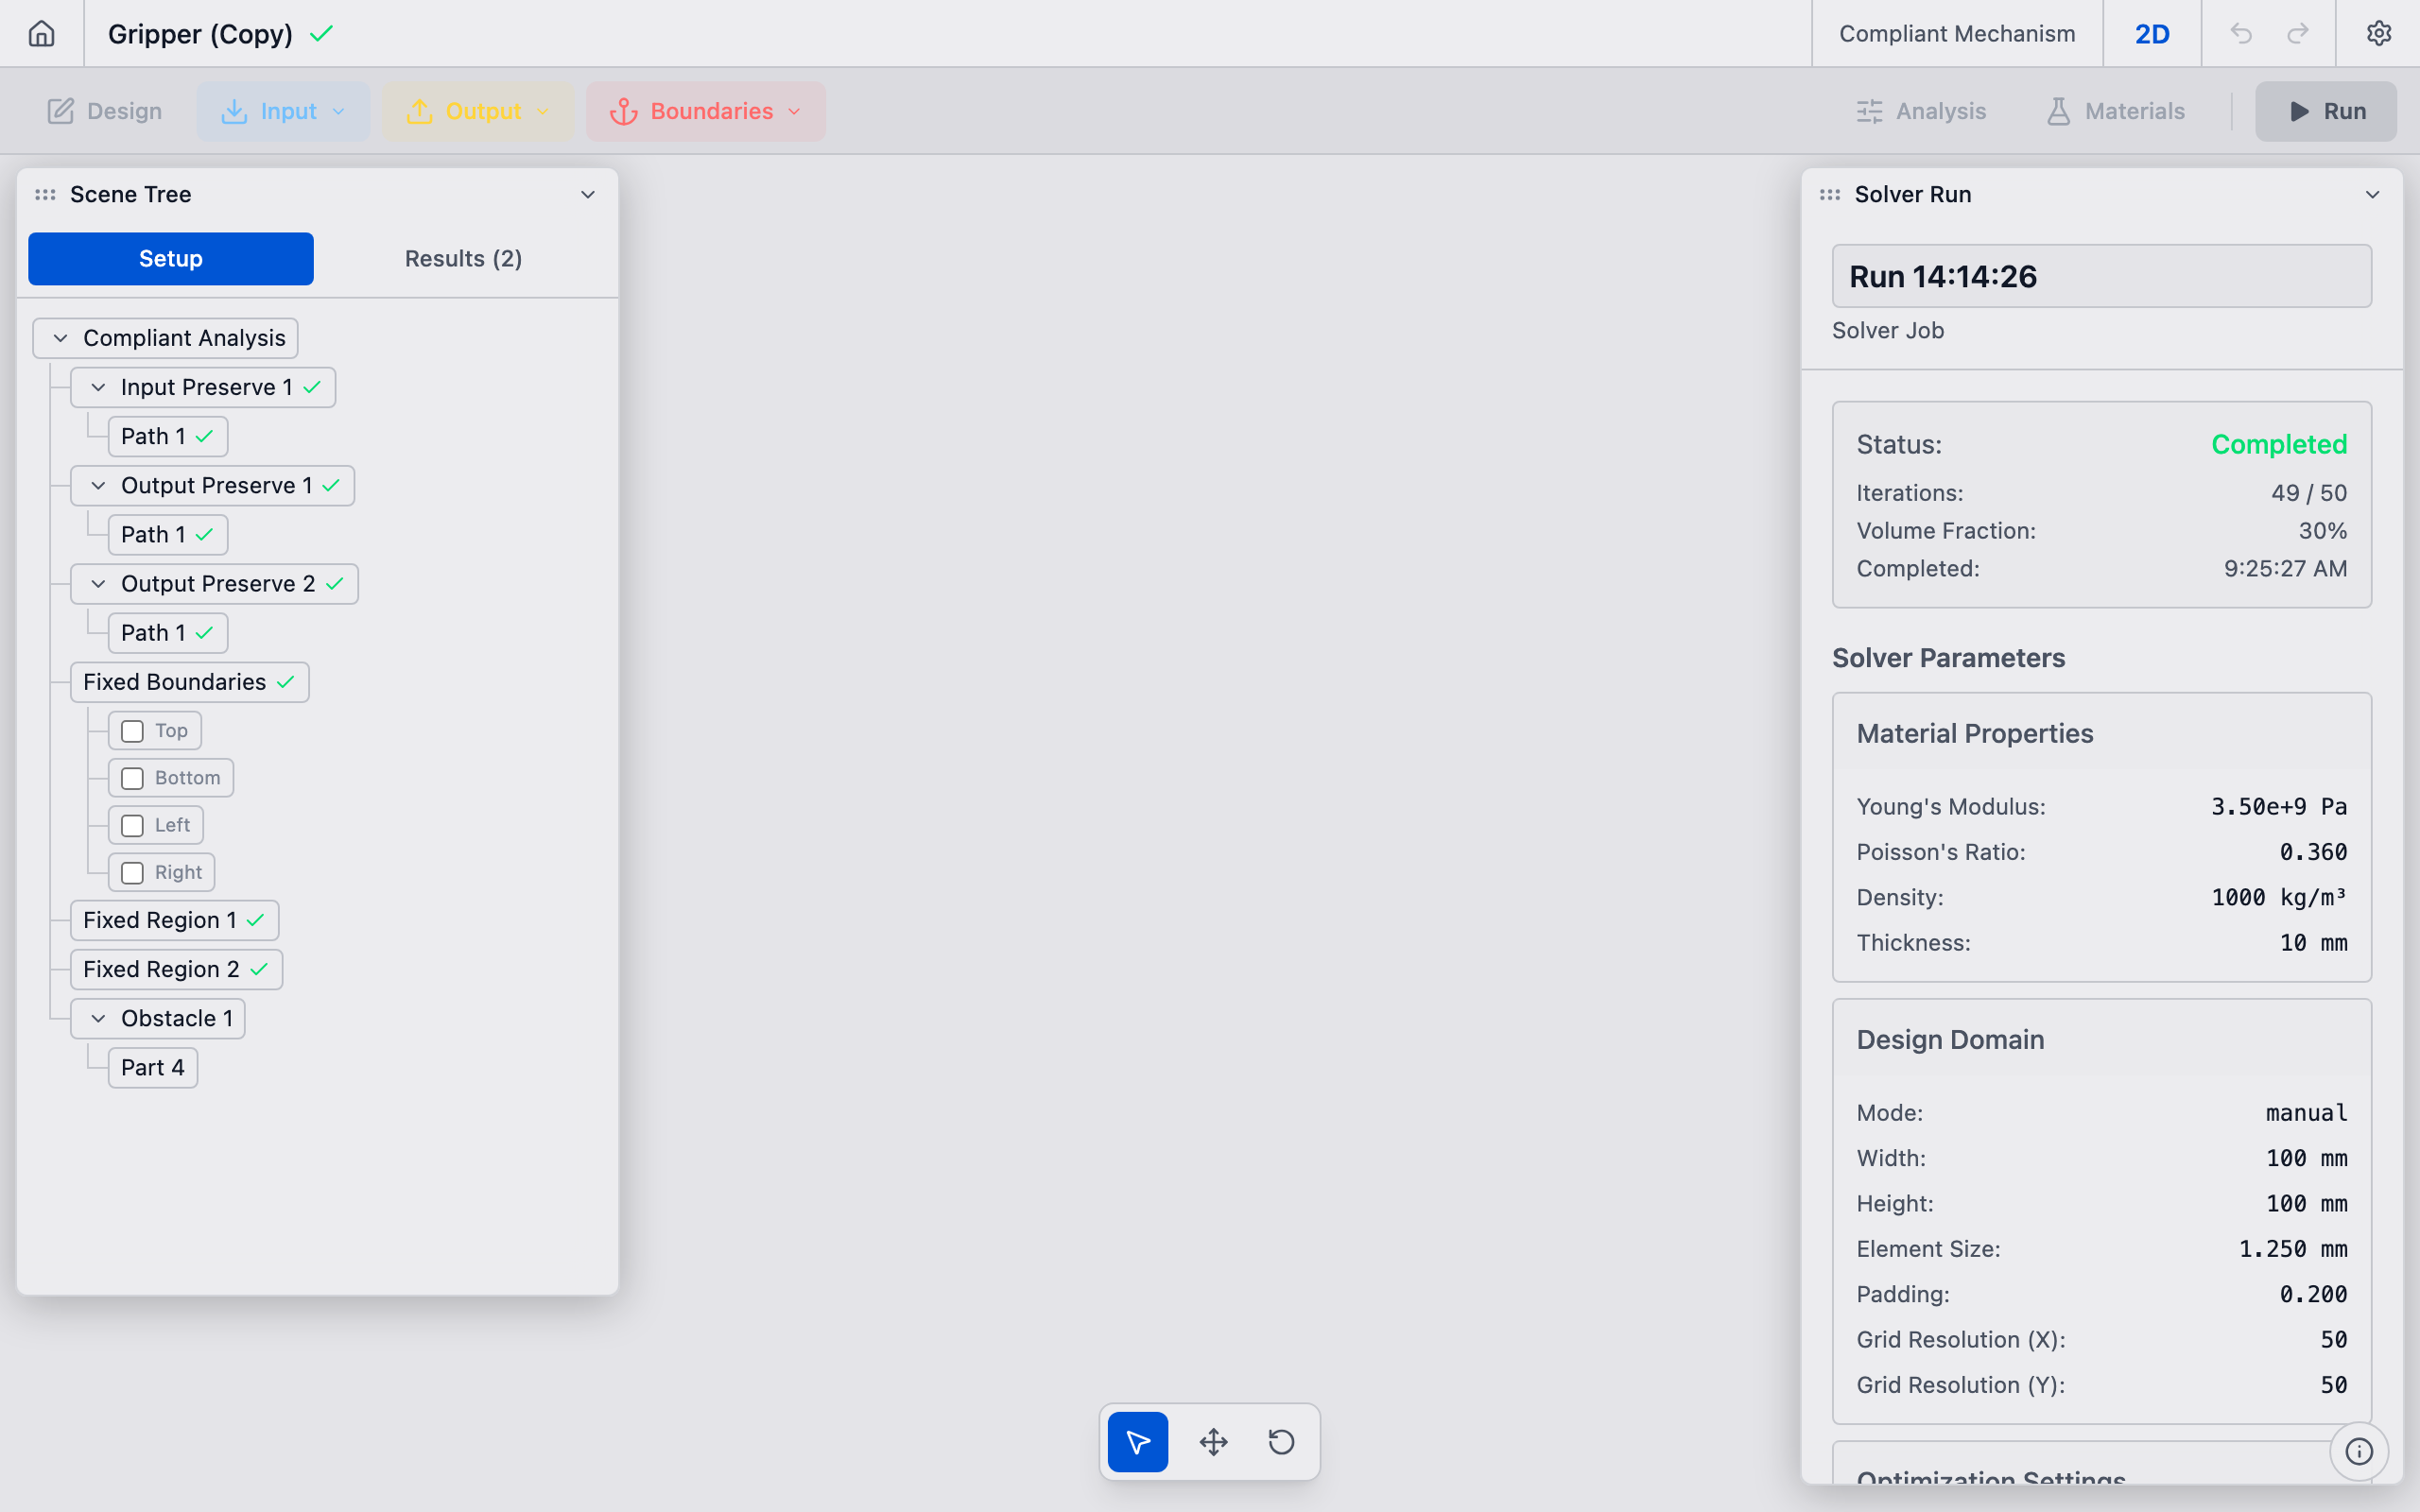
Scene Tree (Floating Panel)
The scene tree is a hierarchical list of every object in your scene. It mirrors the structure of your design problem and appears as a floating panel that can be moved and resized.
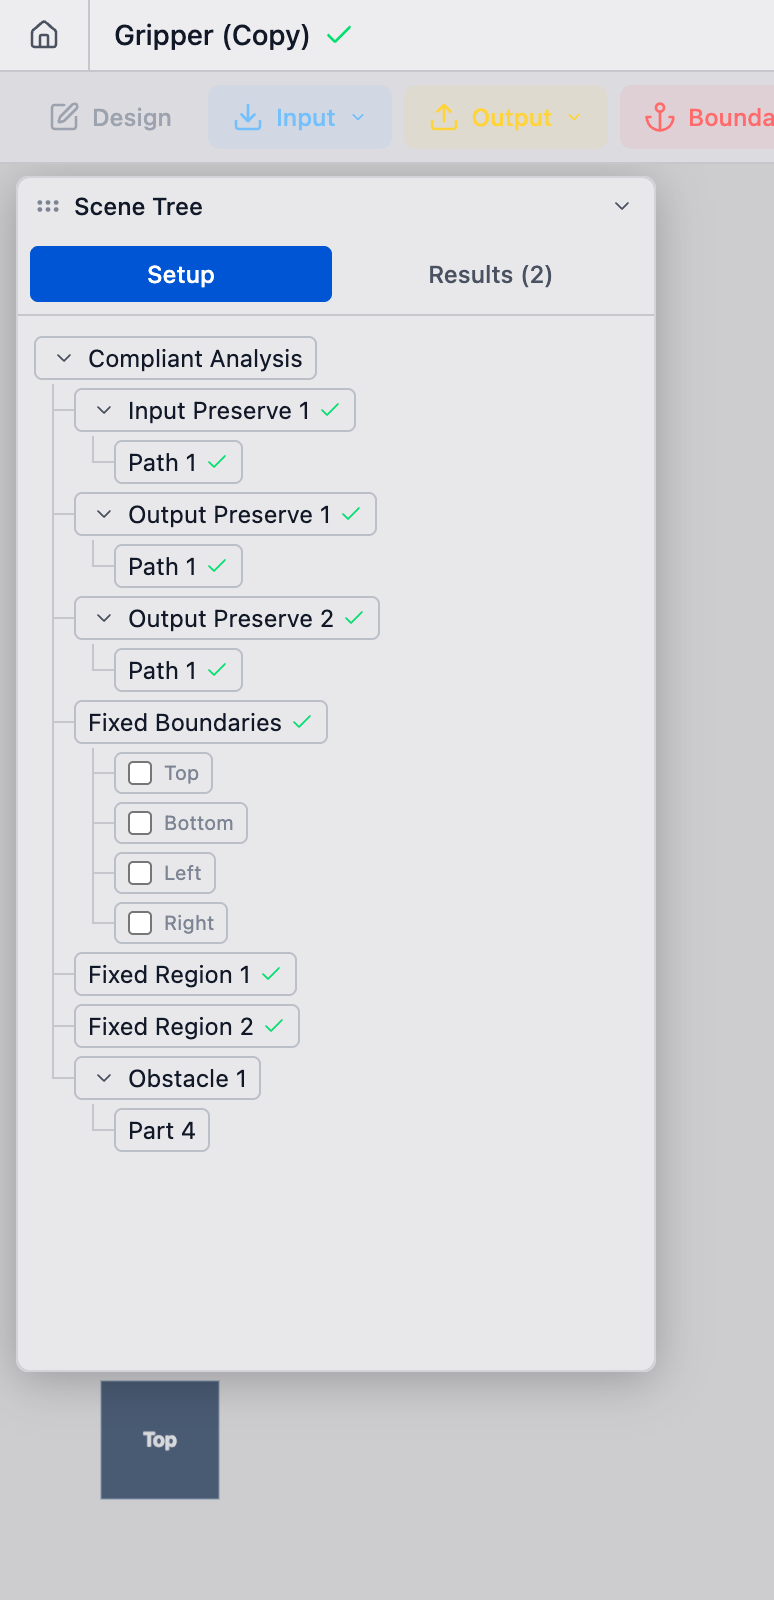
Interacting with the scene tree
- Click an item to select it. The properties panel updates to show that object's settings, and the object highlights in the viewport.
- Right-click an item to access a context menu with options including Rename, Hide/Show, Show Only This, Show All, Hide All, View Properties, and Delete.
- H key — press H with an object selected to toggle its visibility in the viewport.
- Expand/collapse — click the chevron arrow on items with children to expand or collapse their sub-tree.
Object types
The scene tree contains several types of objects:
| Icon | Type | Description |
|---|---|---|
| Cube | Design Domain | The plate or imported geometry that defines the design space |
| Shield | Preserve | A region that must remain solid |
| Lock | Fixed Support | A boundary condition — nodes that cannot move |
| Arrow | Force / Displacement | An applied load or prescribed displacement |
| Gear | Solver | The solver configuration object (contains optimization settings) |
Properties Panel (Floating Panel)
When you select an object in the scene tree or viewport, the properties panel displays its editable parameters. The panel auto-expands when an object is selected.
The panel contents change depending on what type of object is selected:
Design domain properties
- Dimensions — width, height, thickness (for simple shapes)
- Mesh resolution — element count or element size for the solver mesh
- Material — Young's modulus, Poisson's ratio, and density
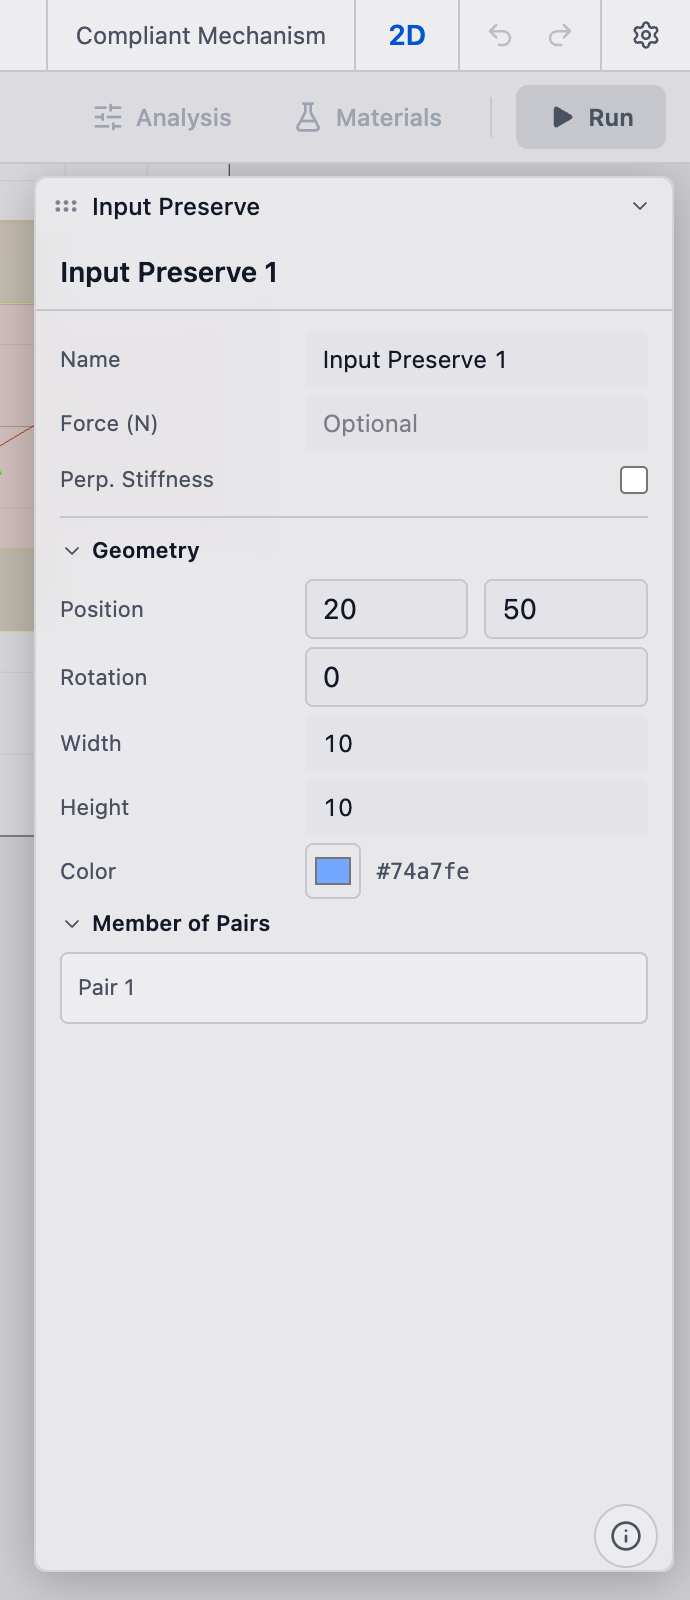
Preserve properties
- Position — X, Y coordinates of the preserve center
- Size — width and height of the preserve region
- Role — whether this preserve is an input pad, output pad, fixed mount, or general keep-solid region
Boundary condition properties
- Type — fixed support, force, or displacement
- Direction — which degrees of freedom are constrained or loaded
- Magnitude — force value (in Newtons) or displacement value (in mm)
Solver properties
- Volume fraction — the target fraction of the design domain that should be filled with material (e.g., 0.3 means keep 30% solid)
- Maximum iterations — how many optimization iterations to run
- Filter radius — controls the minimum feature size in the result
- Penalty factor — the penalization value (controls design sharpness — how crisply the solver separates material from void)
Changing solver parameters after a run has completed does not retroactively update the result. You must re-run the solver to see the effect of parameter changes.
Toolbar
The interface has two toolbars at the top: the Primary Bar and the Secondary Bar.
Primary Bar
The primary bar runs along the very top and provides scene-level controls:
- Home button to return to the scene browser
- Scene name and save status
- Scene type indicator (e.g., Compliant Mechanism, Flexure)
- 2D/3D toggle (for compliant mechanism scenes)
- Undo/Redo buttons (also accessible via Ctrl+Z / Ctrl+Shift+Z)
- Settings gear menu
Secondary Bar
The secondary bar sits below the primary bar and contains the creation tools. It is visible in the setup/design view and slides away when viewing results.
| Button | Action |
|---|---|
| Design | Opens the design settings panel (domain dimensions, mesh settings) |
| Input (dropdown) | Adds input preserves — choose from Rectangle, STEP Model, or STL Model |
| Output (dropdown) | Adds output preserves — choose from Rectangle, STEP Model, or STL Model |
| Boundaries (dropdown) | Adds boundary conditions — choose from Part-based or other boundary types |
| Analysis | Opens the analysis settings panel |
| Materials | Opens the materials panel |
| Run | Submits the current scene to the solver for optimization |
Floating Panels
The Scene Tree, Properties Panel, Color Bar Legend, and Solver Scope (convergence chart) are all floating panels. They share a common interaction model:
- Drag the title bar to reposition a panel anywhere over the viewport.
- Resize by dragging any edge or corner (east, west, south, and the corner handles).
- Collapse / Expand by clicking the chevron button in the title bar. A collapsed panel shows only its title bar.
- Close (where available) by clicking the X button -- for example, the Solver Scope panel.
Panels are clamped so they always remain visible: the top edge cannot move above the secondary toolbar, and the bottom edge stays above the status bar. On window resize, panels automatically re-clamp to stay within bounds.
User Menu
When signed in, your avatar (or initials circle) appears in the top-right of the Primary Bar. Clicking it opens a dropdown with:
| Item | Description |
|---|---|
| Profile | Navigate to your profile page to manage your display name, avatar, and account details. See Manage Profile. |
| Light / Dark Mode | Toggle between the light and dark interface themes. |
| Settings | Open the settings modal (toolbar size, status bar visibility, and other preferences). See Settings. |
| Log out | Sign out of your deFlex account. |
Sync Status Indicator
Next to the scene name in the Primary Bar, a small indicator shows the save state of your scene:
- Saving... (spinning icon) -- a write operation is in progress.
- Saved (green checkmark) -- all changes have been persisted to the cloud.
This works like Google Docs: every edit is auto-saved, so you never need to manually save. The Ctrl/Cmd + S shortcut triggers an explicit save if needed.
Status Bar
A thin bar at the bottom of the viewport shows contextual information at a glance:
| Section | Description |
|---|---|
| Cursor coordinates | Live X/Y position of the cursor in world space, displayed in the active unit system. |
| Selected object | Name and type of the currently selected object (e.g., "Input Pad (Input Preserve)"). |
| Unit switcher | A dropdown on the right side for quickly changing display units. See Unit Switcher. |
| Solver progress | When a solver job is running, a compact progress indicator appears showing the current status. |
The status bar can be toggled on or off in Settings.
Unit Switcher
The unit switcher is located in the status bar. Click the current unit label to open a dropdown of available unit presets (e.g., mm, inches). The selected preset affects all displayed lengths, forces, and pressures throughout the interface -- cursor coordinates, properties panel values, and results metrics. See Switch Units for details.
Results Toolbar
When you switch to the Results tab (after running a solver), the secondary bar transforms into visualization controls organized in groups:
| Group | Controls |
|---|---|
| Heatmap | Toggle the displacement/stress heatmap overlay. Hover or right-click to choose Color By (Magnitude, X, Y) and Color Scale (90th Percentile, Absolute Max, Manual Range). |
| Deformation Animation | Play/Pause button, playback speed slider, and magnification slider for animating the deformed shape. |
| Iteration Cycling | Previous / Play / Next buttons, a scrub slider, an iteration counter, and a speed dropdown. These appear when iteration cycling is active. |
| Panel Toggles | Scope toggles the Solver Scope convergence chart panel. Scale toggles the Color Bar Legend panel. |
Keyboard shortcuts
deFlex supports the following keyboard shortcuts:
| Shortcut | Action |
|---|---|
| Escape | Deselect all |
| H | Toggle visibility of the selected object |
| S | Toggle suppression of the selected object |
| Ctrl+Z / Cmd+Z | Undo |
| Ctrl+Shift+Z / Cmd+Shift+Z | Redo |
| Ctrl+D / Cmd+D | Duplicate selected objects |
| Delete / Backspace | Delete selected objects |
For the full list, see Keyboard Shortcuts.
Next steps
Now that you know your way around the interface, follow the Your First Design tutorial to build a compliant mechanism from scratch in about five minutes.